What can we create with Heatmaps and are we able to do more?
If you’re someone interested in Data Visualization but doesn’t know how to get into it, this blog is for you. In this series, I will be sharing my observations in the world of Data Viz. My primary tool is in Tableau, but I also delve into other tools as well, such as Microsoft Power BI and Looker Studio.
Heatmaps visualizes the intensity of values in a typically 2-dimensional matrix, however, when are heatmaps usually used in data visualization?
Time
The first example below shows the intensity & distribution of likes for JTBC news across time (in a calendar format). This technique is refreshing because it introduces a third variable, time. This can be applied to use-cases where intensity & distribution is variable and changes over time at specific locations, such as flow of goods in the warehouse and identify areas that might have bottlenecks.

Heatmaps are effective visually for users to spot irregular trends, especially if the heatmaps change in real time.
Space
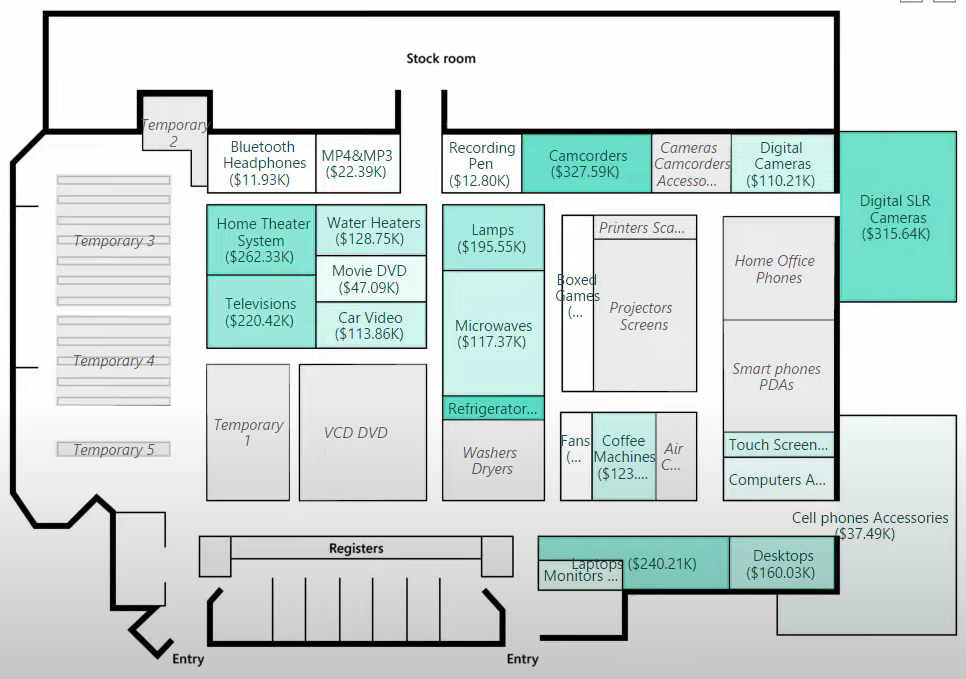
Secondly, custom heatmaps visualizes utilisation according to space, which is possible by involving additional steps such as extensions (in Power BI) and mapping of layout (in Tableau). The example below by SQL BI shows the layout of a retail store, with the value of goods in each department. However, this visualization could be pushed further by considering different factors and different time periods, to make sense of the bigger picture in the retail space.
What are some other interesting use-cases of heatmaps you have observed?
Mentioned visualizations: *Credits to the authors below*
1. JTBC Newsroom Daily Likes Ratio by Minji Kang: https://public.tableau.com/app/profile/.53728568/viz/twbx7_jtbcnewsroomdailylikesratio/likesratio
2. Synoptic Panel by OKVIZ:
https://www.youtube.com/watch?v=MYwNVCyZug0
Cedric
Follow me on Tableau Public
Data Viz Resources:
– DataFam Roundup – weekly news about the Tableau Community
– Tableau Public
– Power BI Data Stories Gallery
